
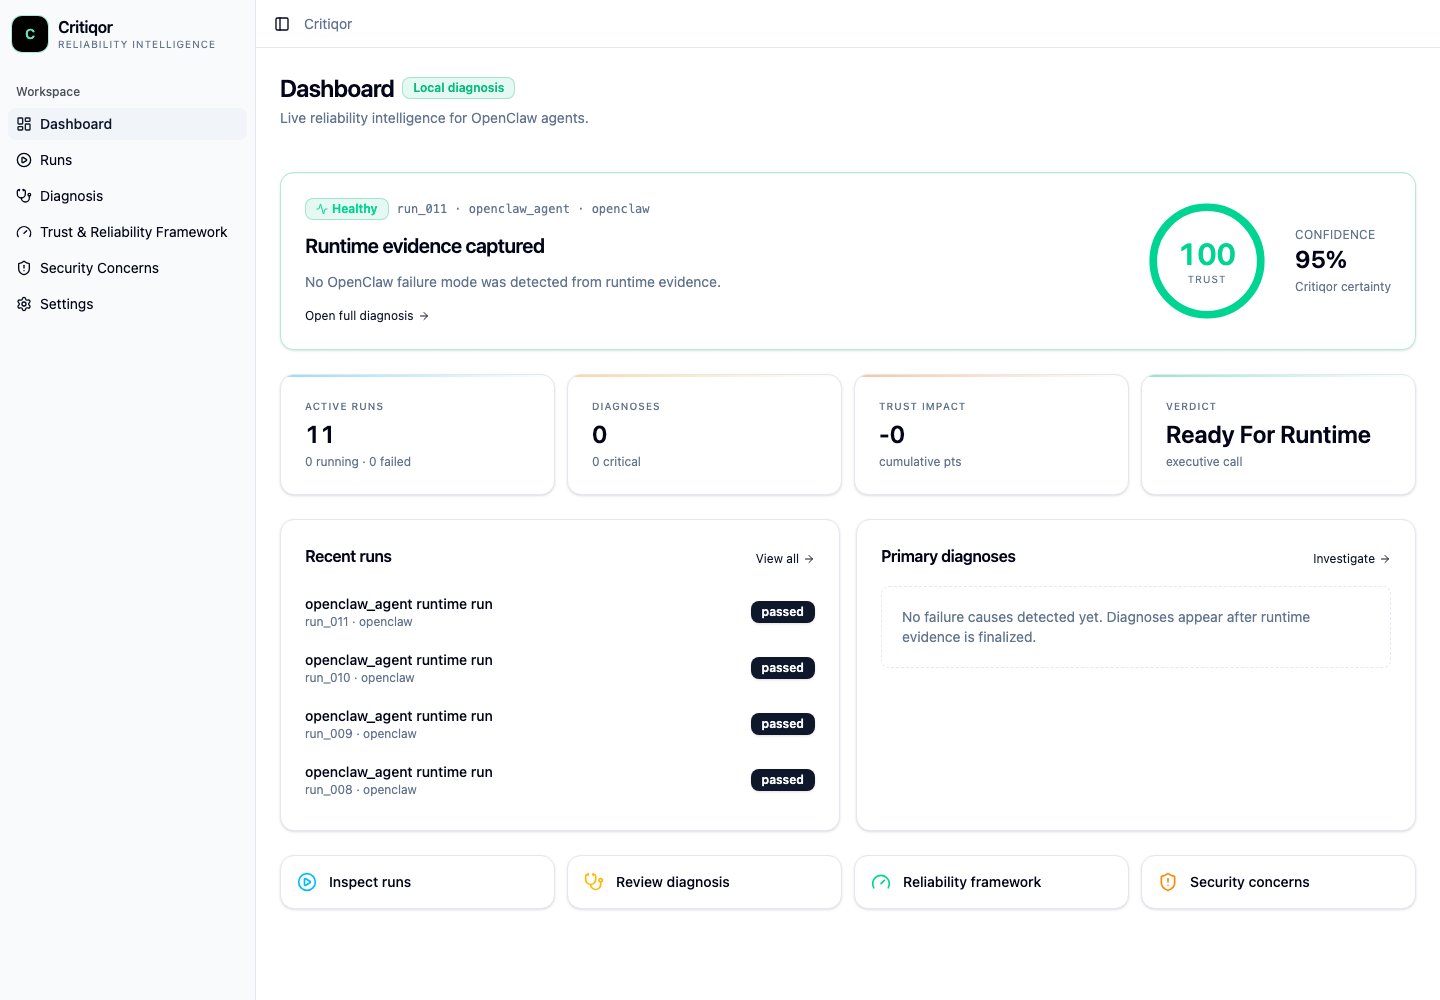
Opening the dashboard
You can open the dashboard in three ways depending on what you need: After finalizing a session — the dashboard opens automatically when you run:Dashboard layout
The dashboard is organized into three broad areas:- Top — Run Summary: High-level signals for the session, including the Executive Summary verdict and Trust Score. Start here to get a fast read on overall health.
- Middle — Diagnostic Detail: The Primary Diagnosis, Runtime Evidence, Runtime Timeline, and Recommendations sections. Go here when you need to understand what happened and what to do about it.
- Bottom — History & Settings: The Historical Runs section, which lists previous sessions so you can track reliability over time, and Settings for managing how the current run is stored.
Quick navigation
Executive Summary
The top-level verdict for your run. Start here to decide whether to dig deeper.
Trust Score
A reliability level (High, Moderate, or Low) backed by observed confidence signals.
Primary Diagnosis
The main finding for the run. Your entry point for debugging when something went wrong.
Runtime Evidence
The detailed record of tool calls, retries, failures, and behavioral patterns observed during the session.
Runtime Timeline
A chronological view of agent activity. Use it to spot retry storms, gaps, and chains of dependent failures.
Recommendations
Actionable next steps tied to specific findings. Your improvement checklist after reviewing a run.
Historical Runs
A list of previous sessions with trust levels and diagnosis summaries for tracking trends over time.
Settings
Configuration options for the current run, including how it is stored and whether it appears in history.
The dashboard runs entirely on your local machine. Nothing is sent to external servers unless you have explicitly configured a backend integration.